DataFocus插件图形开发流程
1 . 插件图形文件的构成部分
插件图形文件内部是由一个_DataFocusPluginChart对象构成的
var _DataFocusPluginChart = {
// 插件图形名
// 插件图形的出图条件
// 插件图形的Axis配置
.....
}
- [必填项] 插件图形名/ 显示名 / 描述
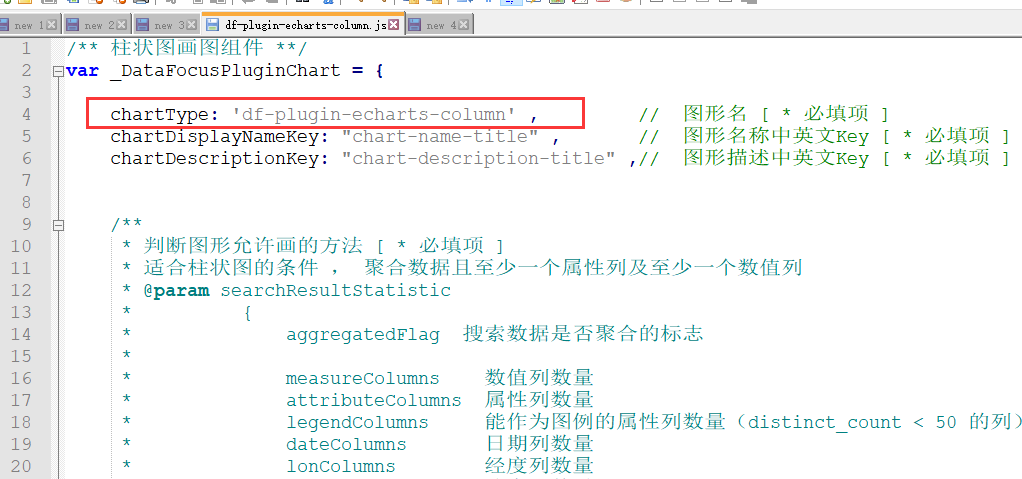
    chartType: 'df-plugin-echarts-column' ,         //  图形名 [ * 必填项 ]
    chartDisplayNameKey: "chart-name-title" ,       //  图形名称中英文Key [ * 必填项 ]
    chartDescriptionKey: "chart-description-title" ,//  图形描述中英文Key [ * 必填项 ]
- [必填项][Object] needAxis 插件图形Axis的配置
目前图形Axis只接受固定两组:
(1)xAxis ; yAxis ; legend ; size ; time ;
(2)Columns ; rows ; values ;
// 图形配置元素 [ * 必填项 ]
    needAxis: {
        // 默认xAxis是属性列 [数组]
        'xAxis': {
            i18nKey: "chart-x-axis-title" ,         //  X轴显示名的key [ 非必填项 ]
            allowMeasureXAxis: true ,               //  是否允许数值类型的X轴 [ 非必填项 ]
        } ,
        // 默认yAxis是数值列 [数组]
        'yAxis': {
            i18nKey: "chart-y-axis-title" ,             //  Y轴显示名的key [ 非必填项 ]
            allowMultiYAxis: true ,                     //  是否允许左右侧边Y轴 [ 非必填项 ]
            multiYAxisKey: "chart-multi-y-axis-title" , //  右侧轴的显示名的key [ 非必填项 ]

            /**
             * 默认Y轴的数量 [ 非必填项 ]
             * 允许系统默认图形配置元素后 ,
             * needAxis中存在Y轴,默认Y轴的数量,—1时即所有的除Size以外的数值列 ;
             * 如果为>0的数值,则取相应数量以内的数值列
             */
            defaultYAxisNumber: -1
        } ,
        // 默认图例时distinct_count在50以内的属性列 [ 数值 ]
        'legend': {
            i18nKey: "chart-legend-title"               //  Legend显示名的Key  [ 非必填项 ]
        } ,
    } ,
- [必填项][function] isSatisfiedTheChart 插件图形的出图判断方法
    /**
     * 判断图形允许画的方法 [ * 必填项 ]
     * 适合柱状图的条件 , 聚合数据且至少一个属性列及至少一个数值列
     * @param searchResultStatistic
     *          {
     *              aggregatedFlag  搜索数据是否聚合的标志
     *              measureColumns    数值列数量
     *                  {
     *                      index
                            columnId
                            columnClassify
                            parent
                            statistics
     *                  }
     *              attributeColumns  属性列数量
     *              legendColumns     能作为图例的属性列数量(distinct_count < 50 的列)
     *              dateColumns       日期列数量
     *              lonColumns        经度列数量
     *              latColumns        纬度列数量
     *              queryResultCount    查询数据结果条目
     *              regionColumns        地理列数组(1:国家集合;1.5:国家;2:省集合;2.5:省;3:市集合;3.5:市;4:区集合;4.5:区;0:其他地理列)
     *          }
     *
     * @return Boolean  true: 当前数据适合画当前图形;false: 当前数据不适合画当前图形
     * */
    isSatisfiedTheChart: function(searchResultStatistic){ return true;  } ,
- [function] getSatisfiedChartAxis 设置needAxis中各个轴的可选项的方法
方法的参数于isSatisfiedTheChart 方法的参数结构一致
/**
 * [选填] 获取当前图形各个needAxis中可选择的配置列
 * @return
 *      {
 *          // 依据needAxis结构返回各个可选列的index
 *          xAxis: [1,2,3] ,
 *          yAxis: [4,5] ,
 *          legend: [1,2,3] ,
 *          size: [4,5] ,
 *          time: [1,2]
 *      }
 * */
getSatisfiedChartAxis: function(searchResultStatistic){
    let self = this ;       //  是当前_DataFocusChartTypes中的对象

    const needAxis = self.needAxis || {};

    if(!needAxis || !searchResultStatistic) return false;
    let theAxisObj = {} ;
    // Time / legend / xAxis / yAxis / size
    // X轴的可选项
    if(needAxis.xAxis){
        theAxisObj.xAxis = searchResultStatistic.attributeColumns&& searchResultStatistic.attributeColumns.map(function (h) { return h.idx; }) ;
    }
    // Y轴的可选项
    if(needAxis.yAxis){
        theAxisObj.yAxis = searchResultStatistic.measureColumns && searchResultStatistic.measureColumns.map(function (h) { return h.idx; }) ;
    }
    // 大小列的可选项
    if(needAxis.size){
        theAxisObj.size = searchResultStatistic.measureColumns && searchResultStatistic.measureColumns.map(function (h) { return h.idx; }) ;
    }
    // 图例列的可选项
    // 有XAxis时,图例则必须在有X轴的情况下才可以有,所以在只有一个属性列时,不允许存在图例列
    if(needAxis.legend){
        if(needAxis.xAxis && searchResultStatistic.attributeColumns && searchResultStatistic.attributeColumns.length <= 1){
            theAxisObj.legend = [] ;
        }else{
            theAxisObj.legend = searchResultStatistic.legendColumns && searchResultStatistic.legendColumns.map(function (h) { return h.idx; }) ;
        }
    }
    // 时间列的可选项
    if(needAxis.time){
        if(needAxis.xAxis && searchResultStatistic.attributeColumns && searchResultStatistic.attributeColumns.length <= 1){
            theAxisObj.time = [] ;
        }else{
            theAxisObj.time = searchResultStatistic.dateColumns && searchResultStatistic.dateColumns.map(function (h) { return h.idx; }) ;
        }
    }

    if(_DataFocusMethod.isObjEmpty(theAxisObj)){
        return false ;
    }else{
        theAxisObj.name = self.name ;
        theAxisObj.type = self.name ;
        return theAxisObj ;
    }
} ,
- [function] initChartAxisConfig初始化当前图轴配置的方法
默认情况下,图形的图轴由系统按一定规则默认分配,如果当前图形不想使用系统的默认图轴分配规则,可自定义默认的图轴配置
/**
 * [选填] 在图形没有图轴配置的情况下,从getSatisfiedChartAxis中图轴可选项中初始化画图配置
 *
 * 初始化规则:
 * 1. 如果当前数据中有两个以上数值列,则默认X轴是数值列,Y轴是一个数值列
 * 2. 如果当前数据只有一个数值列,则默认X轴是属性列,Y轴是数值列
 *
 * @param options
 *      {
 *          tableData   -   查询数据
 *      }
 * // 依据needAxis生成初始的图轴配置值,及各个轴的配置可选项
 *    返回对象名字规则: 可选项是needAxis中各项名字 + Area ; 当前配置项是 cur + needAxis中各项名字
 * @return chartAxis
 *          {
 *              xAxisArea: [  {col_id , index ...} , {} ] ,
 *              curXAxis: [ {col_id , index ...} ]
 *              yAxisArea: [ {col_id , index , min , max ...} , {} ] ,
 *              curYAxis: [ {col_id , index , min , max ...} ] ,
 *              legendArea: [ {col_id , index ...} ],
 *              curLegend: {col_id , index ...} ,
 *              sizeArea: [{col_id , index ...}] ,
 *              curSize: {col_id , index ...} ,
 *              timeArea: [ {col_id , index ...} ] ,
 *              curTime: {col_id , index ...}
 *          }
 *
 * */
initChartAxisConfig: function(options){
    options = options || {} ;
    if(!options.tableData || !options.tableData.headers) return false ;

    let self = this ,               //  是当前_DataFocusChartTypes中的对象
        tableData = options.tableData ,
        headers = tableData.headers  ,
        columns = tableData.columns ;

    console.log("设置scatter初始的图轴配置");
    // charts是依据各个图形中的getSatisfiedChartAxis生成的
    let theMatchedChart = tableData.charts && tableData.charts.find(function(chart){ return (chart.name || chart.type) === self.name ; }) ,
        chartAxis = {} ;
    if(!theMatchedChart){ console.log("当前数据不适合散点图"); return chartAxis ; }

    let getIdIndexInHeader = function(colIdx , headers){
        // 目前charts返回的都是索引
        if(colIdx < headers.length) return colIdx ;

        for(let i = 0 ; i < headers.length ; i++){
            if(headers[i].col_id === colIdx)
                return i ;
        }
        return -1 ;
    } ;
    // 获取图例列及可选数组 [ 默认legend不允许与时间列相同 ]
    if(self.needAxis && self.needAxis.legend){
        chartAxis.legendArea = [];
        let theLegendArea = [] ;
        theMatchedChart.legend && theMatchedChart.legend.forEach(function (c) {
            let curColumnIndex = getIdIndexInHeader(c, headers);
            let obj = headers[curColumnIndex];
            obj.index = curColumnIndex;
            chartAxis.legendArea.push(obj);
            theLegendArea.push(obj) ;
        });

        // 默认使用值distinct count最小的作为图例
        theLegendArea.sort(function(a , b){return a.statistics && b.statistics && a.statistics['unique count'] - b.statistics['unique count'] ; }) ;
        chartAxis.curLegend = theLegendArea[0];
    }

    // 获取XAxis列及可选数组
    if(self.needAxis && self.needAxis.xAxis){
        chartAxis.xAxisArea = [];
        theMatchedChart.xAxis && theMatchedChart.xAxis.forEach(function (c) {
            let curColumnIndex = getIdIndexInHeader(c, headers);
            let obj = $.extend({}, headers[curColumnIndex]);
            obj.header = headers[curColumnIndex];
            obj.index = curColumnIndex;
            chartAxis.xAxisArea.push(obj);
        });

        // 赋值默认的X轴,默认X轴与图例列不能重叠
        let xAxisArea = chartAxis.xAxisArea.filter(function (xAxis) {
            return !(chartAxis.curLegend && xAxis.index === chartAxis.curLegend.index);
        });
        // 如果指令了属性列的数量
        let defaultXAxisNumber = _DataFocusMethod.isPureNumber(self.needAxis.xAxis.defaultXAxisNumber)?self.needAxis.xAxis.defaultXAxisNumber:-1;
        let withoutSortX = xAxisArea && xAxisArea.filter(function(head){ return !head.isSortNoFlag ; }) ;
        // 如果没有排序列的属性列足够分配需要的X轴,则优先使用非排序列的属性列
        if(defaultXAxisNumber < 0){
            chartAxis.curXAxis = withoutSortX.length ? withoutSortX : xAxisArea ;
        }else{
            if(withoutSortX.length >= defaultXAxisNumber){
                chartAxis.curXAxis = withoutSortX.slice(0 , defaultXAxisNumber) ;
            }else{
                chartAxis.curXAxis = xAxisArea.slice(0 , defaultXAxisNumber) ;
            }
        }
    }

    // 获取YAxis列及可选数组 [ 必须计算yAxis的最大值与最小值,计算刻度使用 ]
    if(self.needAxis && self.needAxis.yAxis){
        chartAxis.yAxisArea = [];
        theMatchedChart.yAxis && theMatchedChart.yAxis.forEach(function (c) {
            let curColumnIndex = getIdIndexInHeader(c, headers);
            let obj = $.extend({}, headers[curColumnIndex]);
            obj.header = headers[curColumnIndex];
            obj.index = curColumnIndex;
            obj.direction = "left";
            let min = obj.statistics && obj.statistics.min ,
                max = obj.statistics && obj.statistics.max ;
            // 如果min/max中存在Infinity这类的无穷数据 或者 存在非法数字时,需要从原始数据中重新获取合法数值
            if(!isFinite(min + max) || !_DataFocusMethod.isPureNumber(min) || !_DataFocusMethod.isPureNumber(max)) {
                let theMin = Infinity, theMax = -Infinity;
                columns && columns.forEach(function (d) {
                    if (_DataFocusMethod.isPureNumber(d[curColumnIndex]) && isFinite(d[curColumnIndex])) {
                        theMin = Math.min(theMin, d[curColumnIndex]);
                        theMax = Math.max(theMax, d[curColumnIndex]);
                    }
                });
                min = theMin ;
                max = theMax ;
                // 如果theMin是Infinity, 说明数据表中没有合法的数值,则将其设置成0
                if(Math.abs(theMin) === Infinity) { min = 0 ; max = 0 ;}
            }
            // 如果min是undefined 说明,数据表头中没有统计 且 返回数据中没有合法的数值,则默认设置为0
            if(min === undefined){min = 0 ; max = 0 ;}
            obj.min = min ;
            obj.max = (min === max && max === 0 && min === 0) ? 1 : max;

            chartAxis.yAxisArea.push(obj);
        }) ;

        // 如果有图例列,则Y轴只允许1个;将Y轴中的curSize的列清除
        if(chartAxis.curLegend){
            let theYAxis = chartAxis.yAxisArea.find(function(yAxis){ return true ; }) ;
            if(theYAxis) chartAxis.curYAxis = [theYAxis];
        }else{
            // 没有图例的情况,使用配置中默认的Y轴数量
            let yAxisArea = chartAxis.yAxisArea ;

            let defaultYAxisNumber = _DataFocusMethod.isPureNumber(self.needAxis.yAxis.defaultYAxisNumber)?self.needAxis.yAxis.defaultYAxisNumber:1 ;
            // 如果默认Y轴< 0 , 说明剩下所有可用Y轴全部是默认Y轴
            if(defaultYAxisNumber < 0){
                chartAxis.curYAxis = yAxisArea ;
            }else{
                chartAxis.curYAxis = yAxisArea.slice(0 , defaultYAxisNumber) ;
            }
        }
    }

    // 如果X轴允许配置数值列-------------------------------------------------------------
    // 如果允许X轴是数值列 , 则将数值列加入X轴的可选区域中[ yAxis多时,X轴默认为measure列 ]
    if(self.needAxis && self.needAxis.xAxis && self.needAxis.xAxis.allowMeasureXAxis){
        chartAxis.xAxisArea = [].concat(chartAxis.xAxisArea , chartAxis.yAxisArea);

        // 有Size时,将size使用的数值列分配出去后,如果还有2个以上的数值列,且允许X轴时数值列,则默认x为数值列
        let tempYArea = chartAxis.yAxisArea && chartAxis.yAxisArea.filter(function(yAxis){
            return (chartAxis.curSize && yAxis.idx !== chartAxis.curSize.idx) || !chartAxis.curSize ;
        });
        if(tempYArea && tempYArea.length >= 2){
            chartAxis.curXAxis = tempYArea.slice(0 , 1);
            chartAxis.curYAxis = tempYArea.slice(1 , 2);
        }
    }

    // 因为Legend与Time将属性列全部使用完了,这种时候默认不需要legend , 将Legend分配给XAxis
    if(self.needAxis && self.needAxis.xAxis){
        if(chartAxis.curLegend && !chartAxis.curXAxis.length){
            chartAxis.curXAxis = chartAxis.xAxisArea.filter(function (xAxis) {
                return xAxis.index === chartAxis.curLegend.index ;
            });
            chartAxis.curLegend = undefined ;
        }
    }

    return chartAxis ;
} ,
- [必填项][function] validateAxisConfig 检验插件图形XY轴配置是否合法的方法
/**
     * 判断当前图形的Axis配置是否合法 [ * 必填项 ]
     * 例:X轴不允许为空,Y轴不允许为空,X轴不允许与图例列相同
     * @params [Object]theAxisConfig      -   当前用户手动配置的规则
     *          {
     *              xAxis: [{
     *                  index
     *                  columnId
     *                  type
     *              }] ,
     *              yAxis: [{
     *                  index
     *                  columnId
     *              }] ,
     *              legend: [{
     *                  index
     *                  columnId
     *              }] ,
     *
     *              // 搜素数据的统计信息
     *              searchResultStatistic: {
     *                  aggregatedFlag  搜索数据是否聚合的标志
     *
     *                  measureColumns    数值列数量
     *                  attributeColumns  属性列数量
     *                  legendColumns     能作为图例的属性列数量(distinct_count < 50 的列)
     *                  dateColumns       日期列数量
     *                  lonColumns        经度列数量
     *                  latColumns        纬度列数量
     *                  queryResultCount    查询数据结果条目
     *                  regionColumns        地理列数组(1:国家集合;1.5:国家;2:省集合;2.5:省;3:市集合;3.5:市;4:区集合;4.5:区;0:其他地理列)
     *              }
     *          }
     *
     * 判断条件:
     * 1. xAxis不允许为空
     * 2. yAxis不允许为空
     * 3. 主Y轴不允许为空
     * 4. legend只允许一个
     * 5. legend存在时Y轴只允许一个
     * 6. legend不允许与xAxis重复
     *
     * @return [String]errorKey -   错误提示对应的key;
     * */
    validateAxisConfig: function(theAxisConfig) { let errorKey = ‘’; return errorKey ;}
- [必填项][Array] chartConfigureList图表配置
组件类型type: select / color / input / theme
/ 当前图形的配置项[ *新增图形必填项 ]
    chartConfigureList: [
        {
            key: "category_general",
            title: "category_chart_general",
            options: [
                {
                    //  配置名,唯一标识[ *必填项 ]
                    key: "chart_test_select",
                    //  配置名的中英文key,在对应的i18nObj中有对应的key:value值[ * 必填项 ]
                    title: "option_chart_test_select",
                    //  配置详细描述的中英文key,在对应的i18nObj中有对应的key:value值[ * 必填项 ]
                    description: "option_chart_test_select_desc",
                    //  配置类型  select - 下拉框类型  ; text - 文本输入框 ; input - 数值输入框 ; checkbox  - 复选框 ; color - 颜色选择器
                    type: "select",
                    // select配置时的下拉选项列表 , 下拉选项需要在对应的i18nObj中有对应的key:value值 [ * select 配置中的必填项 ]
                    selection: [
                        "option_test_default",
                        "option_test_default1",
                        "option_test_default2",
                        "option_test_default3"
                    ]
                }
           ]
}
]
- [Object] chartConfigureAdvanced 图表配置的拓展
/**
 * 图形配置的辅助对象:当前图形定义的宏列表 及 宏 解析方法 ; 适配之前图形配置值的方法 ;
 *
 * 当前图形提供的宏列表[ 宏名的命名规则: 开头是%_ 用_连接的大写字符字符串 ]
 * 供自定义数据标签 及 悬浮文本使用,可以让用户配置显示内容
 * 键值对  MacroName : MacroDisplayNameKey
 * */
chartConfigureAdvanced: {
    // 根据宏配置列表,已足够外部组件将 %_NAME:%_VALUE 翻译成 [属性]:[值] 显示给用户
    // 如果当前图形支持换行的宏,则输入时允许输入换行符 ; 否则编辑时也不支持换行符 ;
    chartMacroList: [
        {
            key: '%_NAME' ,
            nameKey: '%_NAME' ,
            descriptionKey: '%_NAME_desc' ,
        } ,
        {
            key: '%_CATEGORY_NAME' ,
            nameKey: '%_CATEGORY_NAME' ,
            descriptionKey: '%_CATEGORY_NAME_desc' ,
        } ,
        {
            key: '%_BR' ,
            nameKey: '%_BR' ,
            descriptionKey: '%_BR_desc' ,
        }
    ] ,
    // 依据当前配置,将 %_NAME:%_VALUE 转译成真实值显示
    /**
     * @param configMacroStr    -   用户配置的带宏的内容
     * @param options
     *          {
     *              type        -
     *
     *              xLabel       -   图形单元对应的属性值 用于实现%_NAME %_CATEGORY_NAME
     *              xLabelIndex  -   图形单元对应的属性索引,用于实现 %_CATEGORY_NUMBER
     *              xLabelTotal  -   图形单元对应的属性上所有值的总和用于实现 %_CATEGORY_TOTAL  %_CATEGORY_AVERAGE  %_PERCENT_OF_CATEGORY
     *              xLabelNumber -   图形单元对应的属性上所有值的个数用于实现 %_CATEGORY_TOTAL  %_CATEGORY_AVERAGE  %_PERCENT_OF_CATEGORY
     *              yValue       -   图形单元对应的值 用于实现 %_VALUE
     *              yAxis        -   图形单元对应的值列 用于实现 %_VALUE_NAME  %_SERIES_NAME
     *              legend       -   图形单元对应的图例名(为空时说明是多Y轴) 用于实现 %_SERIES_NAME
     *              legendIndex  -   图形单元对应的图例索引 用于实现 %_SERIES_NUMBER
     *              legendTotal  -   图形单元对应的图例上所有值的总和,用于实现 %_PERCENT_OF_TOTAL
     *              rowData -  图形单元对应的一整行数据 用于实现%_COLUMN_N的宏
     *          }
     * */
    translateMacro: function(configMacroStr , options){
        options = options || {} ;
        if(!configMacroStr) return false ;

        let macroRegex = /%(_[A-Z0-9]*){1,}/gi ;
        let theMatchedTextValue = '' ,  matchedIndex = 0;
        macroRegex.lastIndex = -1 ;
        for(let i = 0 , execResult ; (execResult = macroRegex.exec(configMacroStr)) && i < 100 ; i++){
            if(!execResult || !execResult[0][0]) break ;
            let theMatchStr = execResult[0] ,
                theMatchIndex = execResult.index ;

            theMatchedTextValue += configMacroStr.substring(matchedIndex , Math.max(theMatchIndex , matchedIndex)) ;
            switch (theMatchStr) {
                case "%_NAME":
                case "%_CATEGORY_NAME":
                    theMatchedTextValue += options.xLabel || '' ;
                    break ;
                case "%_CATEGORY_NUMBER":
                    theMatchedTextValue += options.xLabelIndex || '' ;
                    break ;
                case "%_BR":
                    theMatchedTextValue += options.type === 'label' ? '\n' : '<br/>' ;
                    break;
                default:
                    if(theMatchStr.startsWith("%_COLUMN_")){
                        let theColumnN = parseInt(theMatchStr.substring(9)) ;
                        if(!isNaN(theColumnN) && options.rowData && theColumnN > 0 && theColumnN <= options.rowData.length){
                            theMatchedTextValue += options.rowData[theColumnN -1] ;
                        }
                    }
                    break;
            }

            matchedIndex = theMatchIndex + theMatchStr.length ;
        }

        if(matchedIndex < configMacroStr.length){
            theMatchedTextValue += configMacroStr.substring(matchedIndex) ;
        }

        return theMatchedTextValue ;
    } ,

    // 如果当前图形配置在上线后需要更新配置,需要兼容行为,则在此处处理[ 不同图形兼容方法不一样 ]
    compatibleHistoryConfigure: function(chartConfigure , options){
        if(!options) return false ;
        options = options || {} ;
        // 最大高度限制 变了名字
        if(chartConfigure.attribute_label_max_height !== undefined){
            chartConfigure.x_axis_label_max_height_percent = chartConfigure.attribute_label_max_height * 100 ;
            chartConfigure.attribute_label_max_height = undefined ;
        }
    }
}
- [必填项] [function]drawChart画图方法
插件图形注入进_DataFocus之后,查询完数据,如果数据满足当前图形的画图条件,则会再准备好画图元素后,进入当前画图方法中,会将当前图形对象的画图上下文传入插件图形的画图方法drawChart中
    /**
     * 使用个人画图方法画图形 [*必填项]
     * @params [Object]options  -   当前图形的配置
     *         {
     *               container       -   当前画图的DOM元素
     *               chartAxis       -   当前图形的Axis配置
     *               datas           -   当前画图数据
     *               isResize        -   是否是窗口变化引起的画图[ 如果只是resize可以不需要重新处理数据 ]
     *               chartConfigures -   图形配置
     *               mousedownCallback   -   图形中元素鼠标事件的回调
     *               plugins         -   DataFocus提供的第三方画图库
     *                  {
     *                        d3  		-   d3的v3版本
     *                        echarts 	-   echarts的
*					d3v7		-	d3的v7版本
*					mathTool	-	数学计算方法集合
     *                  }
     *           }
     * **/
    drawChart: function(options){
        options = options || {} ;
        if(!options.container){console.error('DataFocus没有提供画图元素Dom'); return false ; }
        if(!options.currentChart){ console.error('DataFocus没有提供图形实例'); return false ; }
        if(!options.chartAxis){ console.error('DataFocus没有图形的配置信息'); return false ; }
        if(!options.datas){ console.error('DataFocus没有提供画图数据'); return false ; }
        options.container.innerHTML = '新的插件Echarts柱状图形' ;
    } ,
插件图形中元素左右键响应机制
插件图形的画图方法drawChart会接收参数mousedownCallback方法,供插件图形中的元素被鼠标点击时的响应;
需要往mousedownCallback方法中传入的参数列表:
    if(typeof options.mousedownCallback === 'function'){
        options.mousedownCallback(d3.event , {
            TheEventButton: 0 ,			  // 用户伪装鼠标事件左右键【*非必填项】
            dataColumnIndex: [0 , 1] ,      //  图形元素使用的数据属性列的Index数组【*必填项】
            dataRowIndex: 22 ,              //  图形元素使用的数据行数 【*必填项】
        })
     }
因为插件图形在看板中可以适配左键按钮联动的行为,适配右键按钮查看数据明细等操作,所以插件图形中元素被点击时需要将该元素使用的数据行数(dataRowIndex)及对应的属性列数组(dataColumnIndex)传入mousedownCallback中,_DataFocusChart会响应改事件触发联动或右键菜单;
额外的参数TheEventButton是为了适配非鼠标事件需要被伪装成鼠标事件的情况,theEventButton=0时,伪装的是左键;非0时,伪装的是右键;
- [必填项] [Object] i18nObj 插件图形的国际化对象
// 当前图形定制的中英文[ 配置XY轴,图表配置 ] [ *新增图形必填项 ]
i18nObj: {
    chinese: {
        "chart-name-title": "Echarts柱状图" ,
        "chart-description-title": "至少一个属性列,一个数值列" ,

        "chart-x-axis-title": "X轴" ,
        "chart-y-axis-title": "Y轴" ,
        "chart-multi-y-axis-title": "右侧副Y轴" ,
        "chart-legend-title": "图例" ,
    } ,
    english: {
        "chart-name-title": "Echarts Column" ,
        "chart-description-title": "At least one attribute column an one measure column " ,

        "chart-x-axis-title": "X Axis" ,
        "chart-y-axis-title": "Y Axis" ,
        "chart-multi-y-axis-title": "The second Y Axis" ,
        "chart-legend-title": "Legend",
    }
}
- [必填项][function] getTemplateData 样例数据的生成方法
// 为模板问答生成样例数据 [*必填项]
    getTemplateData: function(){
        let theTemplateData = {
            headers: [{
                idx: 0,
                col_id: '10001',
                col_uuid: '10001',
                col_name: '测试属性列',
                data_type: 'ATTRIBUTE',
                operator: '',
                geo_type: '',
                col_type: 'string'
            },{
                idx: 1 ,
                col_id: '10002' ,
                col_uuid: '10002',
                col_name: '测试数值列' ,
                data_type: 'MEASURE',
                operator: 'SUM' ,
                geo_type: '' ,
                col_type: 'int',
                statistics: {
                    sum: 123 ,
                    average: 32 ,
                    min: 5 ,
                    max: 40 ,
                    'standard deviation': 2.5 ,
                    'unique count': 10 ,
                    'variance': 23.5
                }
            }] ,
            columns: [
                ['测试1' , 11] ,
                ['测试2' , 22] ,
                ['测试3' , 33] ,
                ['测试4' , 44] ,
            ],
            default_chart: {
                type: 'df-plugin-echarts-column' ,
                xAxis: [0] ,
                yAxis: [1]
            } ,
            charts: [{
                type: 'df-plugin-echarts-column' ,
                xAxis: [0] ,
                yAxis: [1]
            }]
        };

        return theTemplateData ;
    } ,
2.插件图形注入DataFocus方法
- 测试样例
具体内容请参考 df-plugin-echarts-column.js样例插件图形文件:
/** 柱状图画图组件 **/
var _DataFocusPluginChart = {
chartType: 'df-plugin-echarts-test' , // 图形名 [ * 必填项 ]
chartDisplayNameKey: "chart-name-title" , // 图形名称中英文Key [ * 必填项 ]
chartDescriptionKey: "chart-description-title" ,// 图形描述中英文Key [ * 必填项 ]
/**
* 判断图形允许画的方法 [ * 必填项 ]
* 适合柱状图的条件 , 聚合数据且至少一个属性列及至少一个数值列
* @param searchResultStatistic
* {
* aggregatedFlag 搜索数据是否聚合的标志
*
* measureColumns 数值列数量
* attributeColumns 属性列数量
* legendColumns 能作为图例的属性列数量(distinct_count < 50 的列)
* dateColumns 日期列数量
* lonColumns 经度列数量
* latColumns 纬度列数量
* queryResultCount 查询数据结果条目
* regionColumns 地理列数组(1:国家集合;1.5:国家;2:省集合;2.5:省;3:市集合;3.5:市;4:区集合;4.5:区;0:其他地理列)
* }
*
* @return Boolean true: 当前数据适合画当前图形;false: 当前数据不适合画当前图形
* */
isSatisfiedTheChart: function(searchResultStatistic){
let satisfiedFlag = false ;
// 搜索数据是聚合数据且至少一个属性列及至少一个数值列
if(searchResultStatistic && searchResultStatistic.aggregatedFlag && searchResultStatistic.attributeColumns && searchResultStatistic.measureColumns ){
if(searchResultStatistic.measureColumns.length > 0 && searchResultStatistic.attributeColumns.length > 0 ){
satisfiedFlag = true ;
}
}
return satisfiedFlag ;
} ,
// 图形配置元素 [ * 必填项 ]
needAxis: {
// 默认xAxis是属性列 [数组]
'xAxis': {
i18nKey: "chart-x-axis-title" , // X轴显示名的key [ 非必填项 ]
allowMeasureXAxis: true , // 是否允许数值类型的X轴 [ 非必填项 ]
} ,
// 默认yAxis是数值列 [数组]
'yAxis': {
i18nKey: "chart-y-axis-title" , // Y轴显示名的key [ 非必填项 ]
allowMultiYAxis: true , // 是否允许左右侧边Y轴 [ 非必填项 ]
multiYAxisKey: "chart-multi-y-axis-title" , // 右侧轴的显示名的key [ 非必填项 ]
/**
* 默认Y轴的数量 [ 非必填项 ]
* 允许系统默认图形配置元素后 ,
* needAxis中存在Y轴,默认Y轴的数量,—1时即所有的除Size以外的数值列 ;
* 如果为>0的数值,则取相应数量以内的数值列
*/
defaultYAxisNumber: -1
} ,
// 默认图例时distinct_count在50以内的属性列 [ 数值 ]
'legend': {
i18nKey: "chart-legend-title" // Legend显示名的Key [ 非必填项 ]
} ,
} ,
/**
* 判断当前图形的Axis配置是否合法 [ * 必填项 ]
* 例:X轴不允许为空,Y轴不允许为空,X轴不允许与图例列相同
* @params [Object]theAxisConfig - 当前用户手动配置的规则
* {
* xAxis: [{
* index
* columnId
* type
* }] ,
* yAxis: [{
* index
* columnId
* }] ,
* legend: [{
* index
* columnId
* }] ,
*
* // 搜素数据的统计信息
* searchResultStatistic: {
* aggregatedFlag 搜索数据是否聚合的标志
*
* measureColumns 数值列数量
* attributeColumns 属性列数量
* legendColumns 能作为图例的属性列数量(distinct_count < 50 的列)
* dateColumns 日期列数量
* lonColumns 经度列数量
* latColumns 纬度列数量
* queryResultCount 查询数据结果条目
* regionColumns 地理列数组(1:国家集合;1.5:国家;2:省集合;2.5:省;3:市集合;3.5:市;4:区集合;4.5:区;0:其他地理列)
* }
* }
*
* 判断条件:
* 1. xAxis不允许为空
* 2. yAxis不允许为空
* 3. 主Y轴不允许为空
* 4. legend只允许一个
* 5. legend存在时Y轴只允许一个
* 6. legend不允许与xAxis重复
*
* @return [String]errorKey - 错误提示对应的key;
* */
validateAxisConfig: function(theAxisConfig) {
let theErrorMsgKey = '' ;
if(!theAxisConfig) {
theErrorMsgKey = 'chart-axis-config-null-error' ;
return theErrorMsgKey ;
}
// 1.X轴不允许为空
if(!theAxisConfig.xAxis || !theAxisConfig.xAxis.length){
theErrorMsgKey = 'chart-xy-axis-null' ;
return theErrorMsgKey ;
}
// 2.Y轴不允许为空
if(!theAxisConfig.yAxis || !theAxisConfig.yAxis.length){
theErrorMsgKey = 'chart-xy-axis-null' ;
return theErrorMsgKey ;
}
// 3.主Y轴不允许为空
let theMainYAxis = theAxisConfig.yAxis.filter(function(yAxis){ return yAxis.direction !== 'right' ; }) ;
if(!theMainYAxis || !theMainYAxis.length){
theErrorMsgKey = 'chart-left-y-axis-null' ;
return theErrorMsgKey ;
}
// 图例不为空的情况下
if(theAxisConfig.legend){
// 3. 图例只允许一个
if(theAxisConfig.legend.length > 1){
theErrorMsgKey = 'chart-legend-too-much' ;
return theErrorMsgKey ;
}
// 4. 有图例的情况下,Y轴不允许多个
if(theAxisConfig.legend.length && theAxisConfig.yAxis.length> 1){
theErrorMsgKey = 'chart-y-axis-too-much-with-legend' ;
return theErrorMsgKey ;
}
// 5. 有图例的情况下,图例不允许与X轴相同
for(let i = 0 ; i < theAxisConfig.legend.length ; i ++){
let theLegend = theAxisConfig.legend[i] ,
theMatchedLegend = theAxisConfig.xAxis && theAxisConfig.xAxis.find(function(xAxis){
return xAxis.index === theLegend.index ;
});
if(theMatchedLegend){
theErrorMsgKey = 'chart-x-legend-axis-not-equal' ;
return theErrorMsgKey ;
break ;
}
}
}
// 当前图形需要将所有属性列利用起来
let theSearchResultStatistic = theAxisConfig.searchResultStatistic ;
if(theSearchResultStatistic){
let theUsedAttribute = 0 ;
if(theAxisConfig.xAxis){ theUsedAttribute += theAxisConfig.xAxis.length ;}
if(theAxisConfig.legend){ theUsedAttribute += theAxisConfig.legend.length ;}
if(theSearchResultStatistic.attributeColumns && theSearchResultStatistic.attributeColumns.length > theUsedAttribute){
theErrorMsgKey = 'chart-need-all-attribute-columns' ;
return theErrorMsgKey ;
}
}
return theErrorMsgKey ;
} ,
// 当前图形的配置项[ *新增图形必填项 ]
chartConfigureList: [
{
key: "category_general",
title: "category_chart_general",
options: [
{
// 配置名,唯一标识[ *必填项 ]
key: "chart_test_select",
// 配置名的中英文key,在对应的i18nObj中有对应的key:value值[ * 必填项 ]
title: "option_chart_test_select",
// 配置详细描述的中英文key,在对应的i18nObj中有对应的key:value值[ * 必填项 ]
description: "option_chart_test_select_desc",
// 配置类型 select - 下拉框类型 ; text - 文本输入框 ; input - 数值输入框 ; checkbox - 复选框 ; color - 颜色选择器
type: "select",
// select配置时的下拉选项列表 , 下拉选项需要在对应的i18nObj中有对应的key:value值 [ * select 配置中的必填项 ]
selection: [
"bar",
"line",
"scatter",
"pie"
]
} ,
{
key: "chart_test_input_text",
title: "option_chart_test_input_text",
description: "option_chart_test_input_text_desc",
type: "text"
} ,
{
key: "chart_test_input_number",
title: "option_chart_test_input_number",
description: "option_chart_test_input_number_desc",
type: "input",
defaultNumber: 10 , // 当前数值输入框的默认值 [ 非必填项 ]
min: 0 , // 当前数值输入框的最小值 [ 非必填项 ]
max: 100 // 当前数值输入框的最大值 [ 非必填项 ]
} ,
{
key: "chart_test_checkbox",
title: "option_chart_test_checkbox",
description: "option_chart_test_checkbox_desc",
type: "checkbox"
} ,
{
key: "chart_test_color",
title: "option_chart_test_color",
description: "option_chart_test_color_desc",
type: "color"
} ,
{
key: "chart_test_measure_color_array",
title: "option_chart_test_measure_color_array",
description: "option_chart_test_measure_color_array",
type: "colorArray"
} ,
{
key: "chart_test_attribute_color_array",
title: "option_chart_test_attribute_color_array",
description: "option_chart_test_attribute_color_array",
type: "attrColorArray"
} ,
]
}
] ,
/**
* 使用个人画图方法画图形 [*必填项]
* @params [Object]options - 当前图形的配置
* {
* container - 当前画图的DOM元素
* chartAxis - 当前图形的Axis配置
* datas - 当前画图数据
* isResize - 是否是窗口变化引起的画图
* chartConfigures - 图形配置
* plugins - DataFocus提供的第三方画图库
* {
* d3 - d3的v3版本
* echarts - echarts的
* }
* }
* **/
drawChart: function(options){
options = options || {} ;
if(!options.container){console.error('DataFocus没有提供画图元素Dom'); return false ; }
if(!options.currentChart){ console.error('DataFocus没有提供图形实例'); return false ; }
if(!options.chartAxis){ console.error('DataFocus没有图形的配置信息'); return false ; }
if(!options.datas){ console.error('DataFocus没有提供画图数据'); return false ; }
console.log(options.chartConfigures)
console.log(options.datas)
options.container.removeAttribute("_echarts_instance_")
var myChart = options.plugins.echarts.init(options.container);
var option;
option = {
xAxis: {
type: 'category',
data: []
},
yAxis: {
type: 'value'
},
series: [{
data: [],
type: 'bar',
showBackground: true,
backgroundStyle: {
color: 'rgba(180, 180, 180, 0.2)'
}
}]
};
if(options.chartConfigures){
if(options.chartConfigures.hasOwnProperty('chart_test_color')){
option.series[0].backgroundStyle.color=options.chartConfigures.chart_test_color
}
if(options.chartConfigures.hasOwnProperty('chart_test_checkbox')){
option.series[0].showBackground=options.chartConfigures.chart_test_checkbox
}
if(options.chartConfigures.hasOwnProperty('chart_test_select')){
option.series[0].type=options.chartConfigures.chart_test_select
}
}
options.datas.columns.forEach(item => {
option.xAxis.data.push(item[1])
option.series[0].data.push(item[0])
});
option && myChart.setOption(option);
console.log("画图了")
} ,
// 为模板问答生成样例数据
getTemplateData: function(){
let theTemplateData = {
headers: [{
idx: 0,
col_id: '10001',
col_uuid: '10001',
col_name: '测试属性列',
data_type: 'ATTRIBUTE',
operator: '',
geo_type: '',
col_type: 'string'
},{
idx: 1 ,
col_id: '10002' ,
col_uuid: '10002',
col_name: '测试数值列' ,
data_type: 'MEASURE',
operator: 'SUM' ,
geo_type: '' ,
col_type: 'int',
statistics: {
sum: 123 ,
average: 32 ,
min: 5 ,
max: 40 ,
'standard deviation': 2.5 ,
'unique count': 10 ,
'variance': 23.5
}
}] ,
columns: [
['测试1' , 11] ,
['测试2' , 22] ,
['测试3' , 33] ,
['测试4' , 44] ,
],
default_chart: {
type: 'df-plugin-echarts-column' ,
xAxis: [0] ,
yAxis: [1]
} ,
charts: [{
type: 'df-plugin-echarts-column' ,
xAxis: [0] ,
yAxis: [1]
}]
};
return theTemplateData ;
} ,
// 当前图形定制的中英文[ 配置XY轴,图表配置 ] [ *新增图形必填项 ]
i18nObj: {
chinese: {
"chart-name-title": "图形插件测试" ,
"chart-description-title": "至少一个属性列,一个数值列" ,
"chart-x-axis-title": "X轴" ,
"chart-y-axis-title": "Y轴" ,
"chart-multi-y-axis-title": "右侧副Y轴" ,
"chart-legend-title": "图例" ,
"chart-axis-config-null-error": "系统没有传入当前用户的Axis配置信息" ,
"chart-xy-axis-null": "X轴或Y轴不能为空" ,
"chart-left-y-axis-null": "左侧主Y轴不允许为空" ,
"chart-legend-too-much": "图例只允许一个" ,
"chart-y-axis-too-much-with-legend": "图例存在时,Y轴只允许一个" ,
"chart-x-legend-axis-not-equal": "X轴不允许与图例相同" ,
"chart-need-all-attribute-columns": "当前图形需要将所有的属性列利用起来",
"category_chart_general": "通用" ,
"option_chart_color_theme": "颜色主题",
"option_chart_test_select": "测试下拉框" ,
"option_chart_test_select_desc": "测试下拉框描述详情" ,
"option_test_default": "测试下拉选项",
"option_test_default1": "测试下拉选项1",
"option_test_default2": "测试下拉选项2",
"option_test_default3": "测试下拉选项3",
"option_chart_test_input_text":"测试文本输入框",
"option_chart_test_input_text_desc":"测试文本输入框描述详情",
"option_chart_test_input_number":"测试数字输入框",
"option_chart_test_input_number_desc":"测试数字输入框描述详情",
"option_chart_test_checkbox":"测试复选框",
"option_chart_test_checkbox_desc":"测试复选框描述详情",
"option_chart_test_color":"测试颜色选择器",
"option_chart_test_color_desc":"测试颜色选择器描述详情",
"option_chart_test_measure_color_array": "测试数值颜色区间",
"option_chart_test_measure_color_array_desc": "测试数值颜色区间描述详情",
"option_chart_test_attribute_color_array": "测试属性颜色",
"option_chart_test_attribute_color_array_desc": "测试属性颜色描述详情",
} ,
english: {
"chart-name-title": "Chart Plugin Test" ,
"chart-description-title": "At lease an attribute column and a measure column" ,
"chart-x-axis-title": "X Axis" ,
"chart-y-axis-title": "Y Axis" ,
"chart-multi-y-axis-title": "The second Y Axis" ,
"chart-legend-title": "Legend",
"chart-axis-config-null-error": "系统没有传入当前用户的Axis配置信息" ,
"chart-xy-axis-null": "X轴或Y轴不能为空" ,
"chart-left-y-axis-null": "左侧主Y轴不允许为空" ,
"chart-legend-too-much": "图例只允许一个" ,
"chart-y-axis-too-much-with-legend": "图例存在时,Y轴只允许一个" ,
"chart-x-legend-axis-not-equal": "X轴不允许与图例相同" ,
"chart-need-all-attribute-columns": "当前图形需要将所有的属性列利用起来",
"category_chart_general": "通用" ,
"option_chart_color_theme": "颜色主题",
"option_chart_test_select": "测试插件图形中的配置名" ,
"option_chart_test_select_desc": "测试插件图形中的配置描述详情" ,
"option_test_default": "测试默认选项",
"option_test_default1": "测试默认选项1",
"option_test_default2": "测试默认选项2",
"option_test_default3": "测试默认选项3",
}
} ,
}- 本地调试时注入方法
本地构造样例数据,构造drawChart方法的参数,本地测试画图方法是否正常
    import pluginChart from '/fdemo/static/js/df-plugin-echarts-column.js' ;
    import d3 from 'd3' ;
    import echarts from 'echarts' ;
    pluginChart.drawChart({
        container: $('#chart-container') ,
        chartAxis: {
            curXAxis: [{
                col_uuid: '' ,

            }] ,
            curYAxis: [] ,
            curLegend: {
            }
        } ,
        datas: { 本地构造的样例数据 },
        chartConfigures: {
            chart_test_select: 'option_test_default1'
        } ,
        plugins: {
            d3: d3 ,
            echarts: echarts
        }
    }) ;
- 将插件图形加入加入DataFocus系统时注入方法
后期DataFocus会开放上传插件文件的入口,将本地开发的图形文件注入到系统中,手动启动系统的检测机制,检测成功则可以进入系统使用;
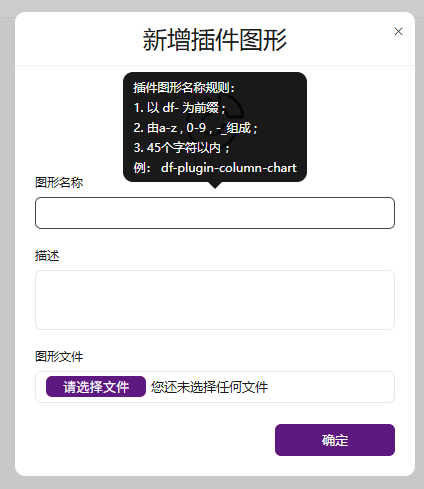
在系统管理-》全局配置-》插件图形中增加插件图形
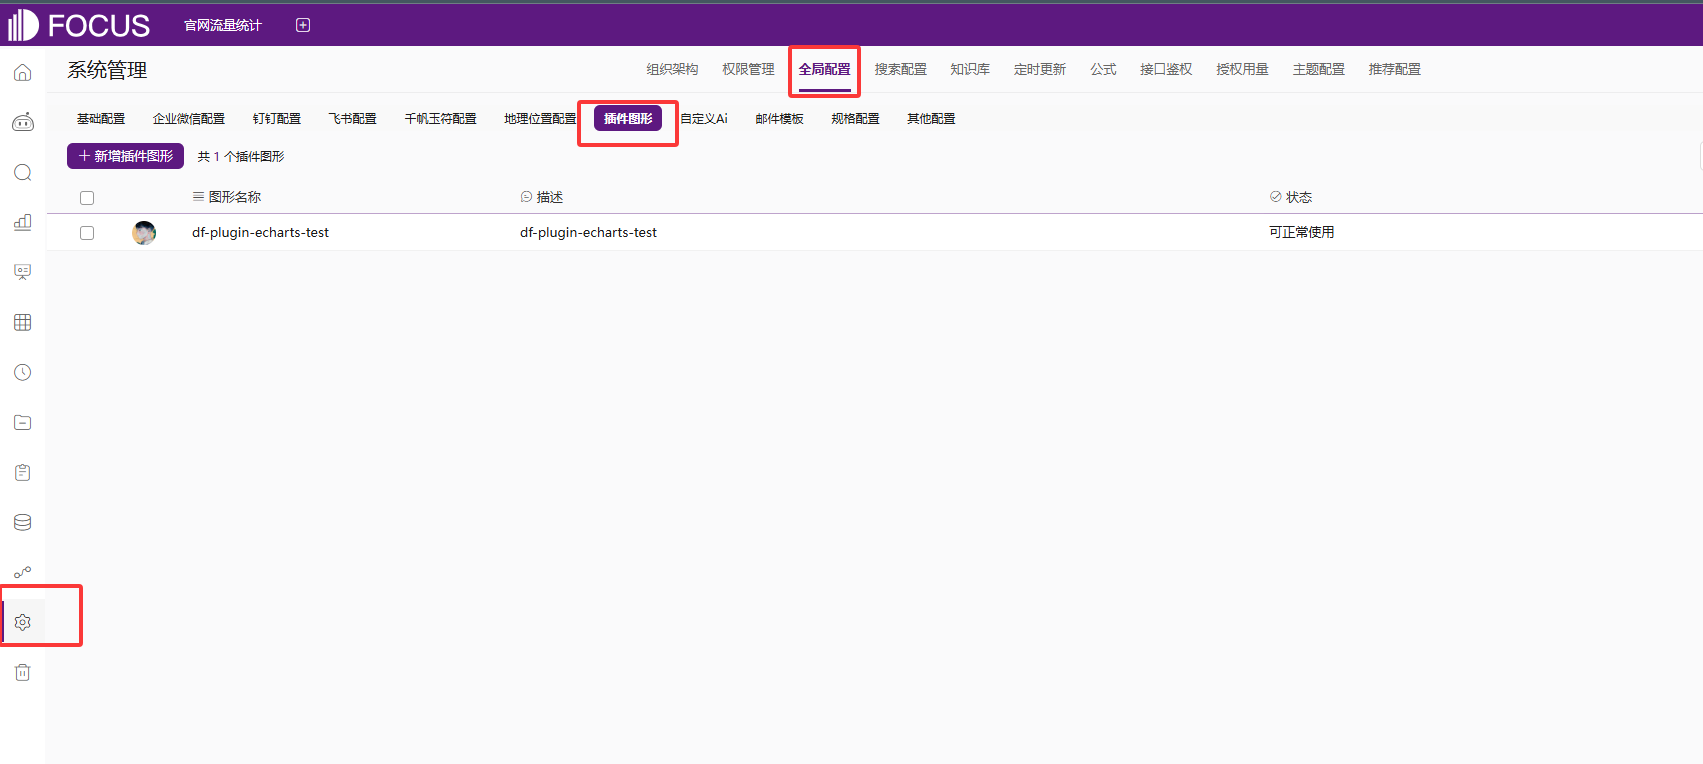
新增插件图形,此处的插件图形名称必须与文件内的chartType保持一致
增加完图形插件后,系统会检测当前插件图形成功后,在搜索页面既可使用
3.插件图形限制
不允许内部引入其他地址中的插件,只允许使用DataFocus中提供的插件
- d3[ v3版本 ]
- Echarts [ 4.X版本 ]